Browser statistics, December 2017 at FINN.no#
Yuletide is coming real soon now, and we haven’t published browser statistics for 2017 yet! The 2016 edition is here if you want to compare.
How many visitors use a desktop or laptop?
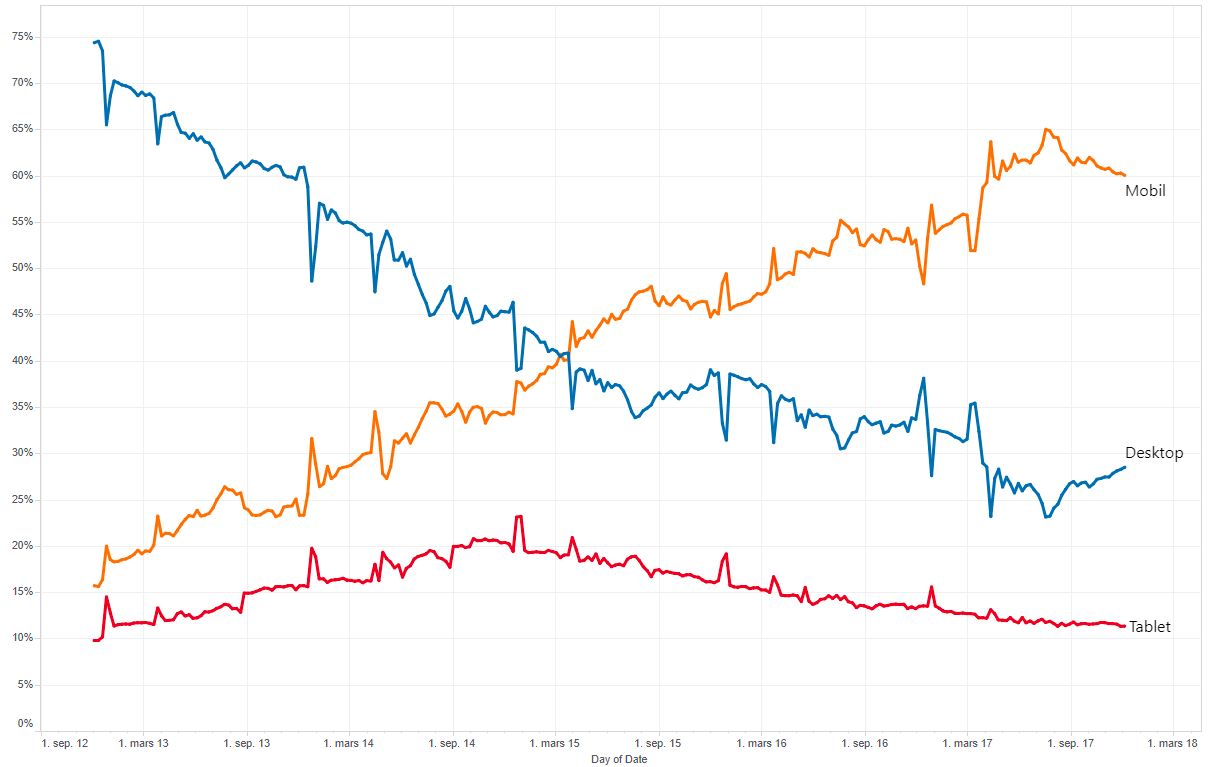
The trend continues, a higher percentage of the traffic is coming from a mobile terminal this year than in 2016, but the trend is that the growth of the curve seems to flatten.
Our first graph shows the share of our users using a mobile phone, tablet or a desktop computer to access FINN.no, regardless of whether they use our responsive web app (m.finn.no), or a native Android or iPhone app. 72% of our visits are now from a smartphone or a tablet. The traditional desktop/laptop has a market share of 28%.
Which offering/”app” of FINN are people using, regardless of whether the device is a desktop/laptop, mobile or tablet?
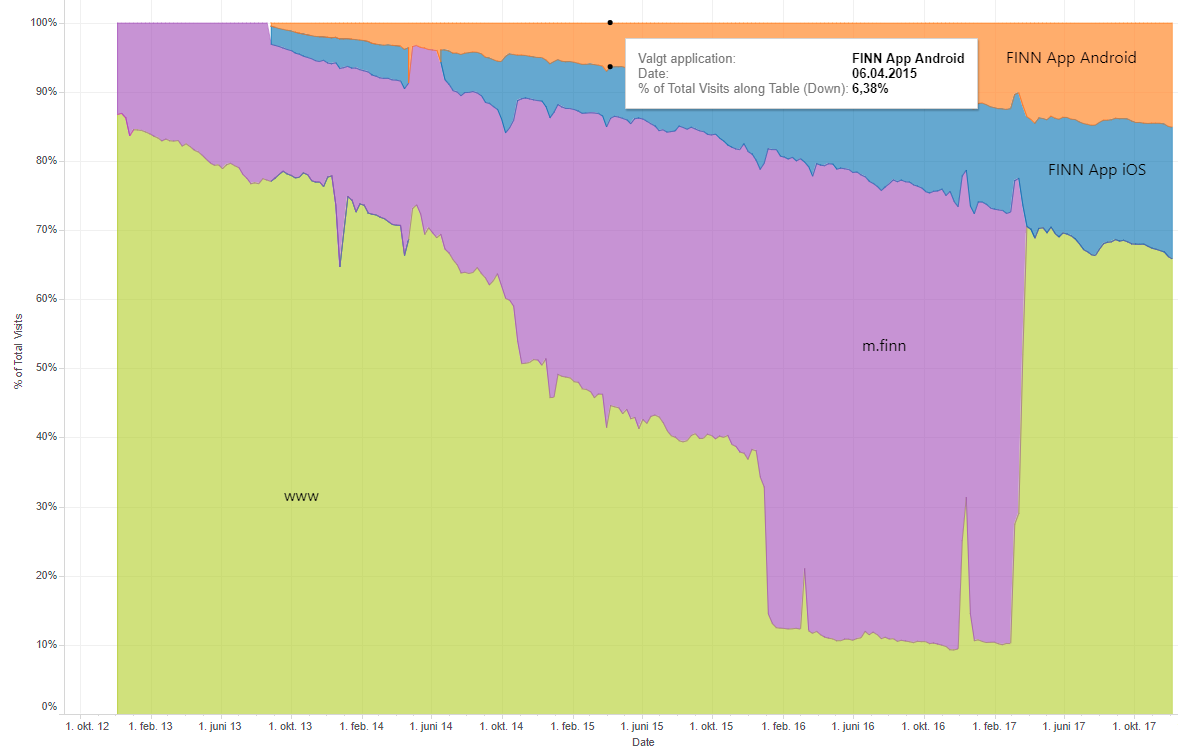
Given that a user is on a mobile or a tablet - are they using the web-version or the app? For the first time the majority of those accessing FINN from a mobile device use our native app - the www.finn.no share of the visits is down to 48%.
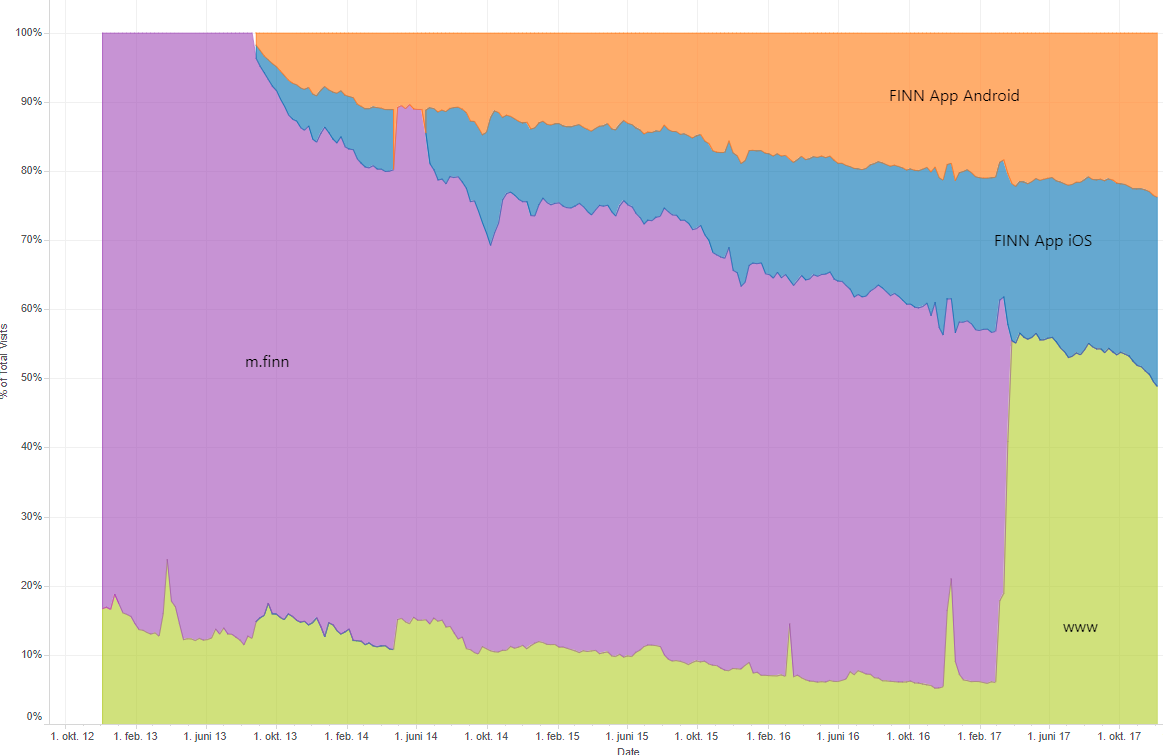
These graphs also shows that we changed the domain name again this spring, so that all web traffic is served from www.finn.no, and not m.finn.no any more.
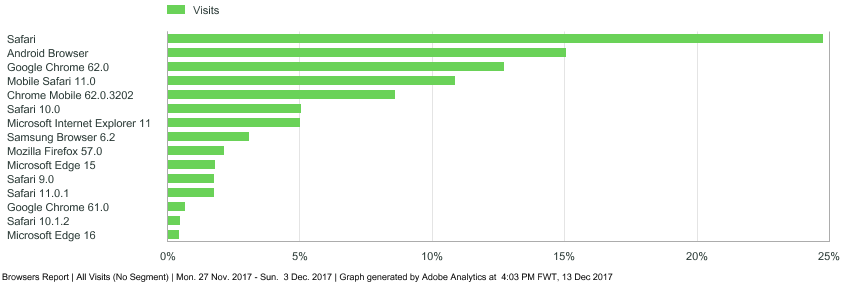
Browsers and devices
The browser war is now only a memory of the veterans, but we still have to debug bugs in specific browsers from time to time, and it’s useful to have an idea of which browsers could or should be ignored.
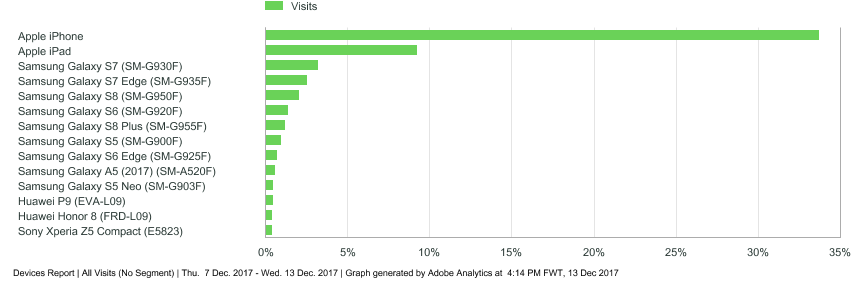
Let’s also look at the which devices are the most popular:
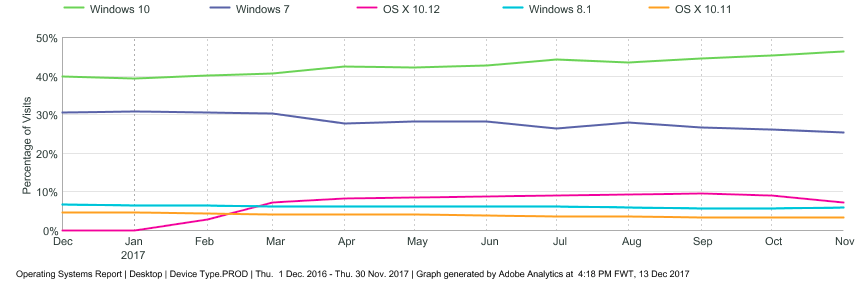
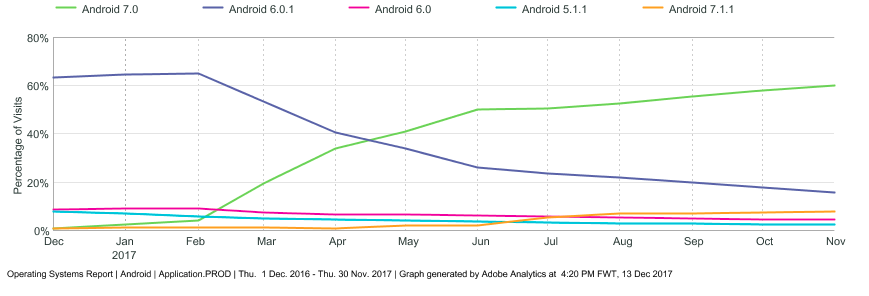
Operating systems
We’re not using our mobiles all the time, so lte’s take a look at the operating system versions. The changes here go quite slowly, but the longer trend is that Windows 10 is still increasing over Windows 7 and 8.
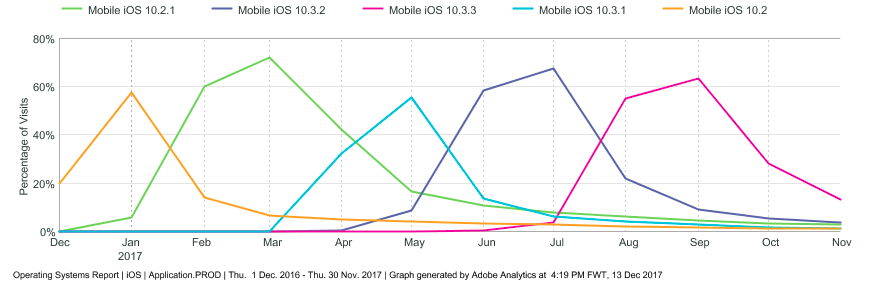
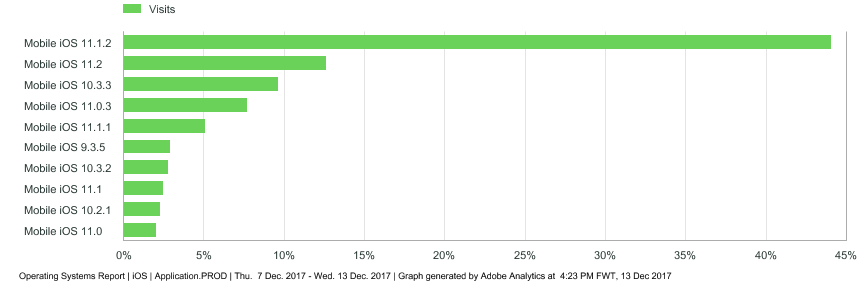
Distribution of iOS versions - it’s interesting to see how quickly a new version is rolled out and dominating. (Note that iOS 11 did not fit into this graph, but the last week, iOS 11.1.2 was the biggest.)
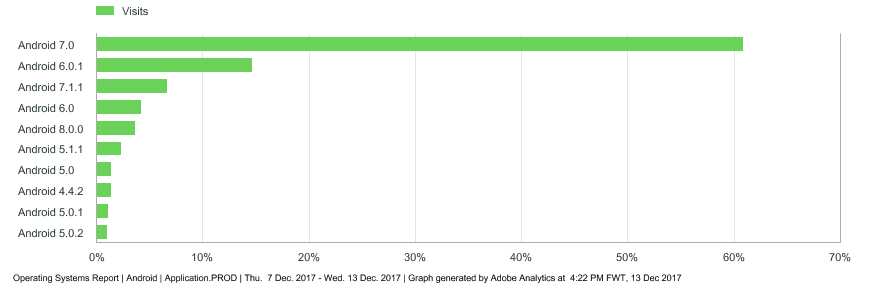
…especially compared to Android:
A list fits more elements than a line graph, so here are the top 10 iOS and Android versions the second week of December 2017:
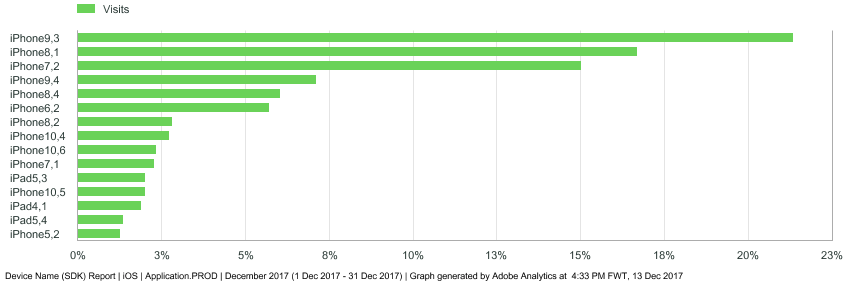
There are many models of iPhone, and though we have some doubts about the correctness of these data, this report still gives an indicator.