If you want to travel from Oslo to London, you may end up getting results which include layovers in far-away places. Do you really want to spend a night at the airport in Moscow if you only want to go from Oslo to London? Probably not, but nonetheless, some of the results we receive at the FINN Flight Search are those kind of travels. Those travels may be really cheap, ending up at the top of our result list as we sort by price, but they are mostly garbage and we do not want our users to be confused by those outliers. We want them to go away!
The old solution
We have tried to fix this before. With limited success. A solution we used a couple of years back was something like this:
x = 3 * Average of the three shortest flights
We removed results with duration > x. This works fine on short travels, like a two-hour flight from Oslo to London. With the given formula, all trips longer than 6 hours to London will be removed. That’s ok.
However, it doesn’t work too well on longer flights. If you want to go from Oslo to Bangkok, you would probably spend at least 11 hours in the air. In that case, it would be too conservative to just remove the flights that are 33 hours or more.
A theoretical solution
The correct way to remove the outliers is by finding the quartiles. When the quartiles are found, the upper fence is defined by
Upper fence = Q1 + 1.5 * IQR
Where IQR is the Interquartile Range; Q3 - Q1.
We are using Solr at FINN, but the stats query in Solr does not give us the quartiles out of the box, so we would need to do a separate query to calculate the quartiles. Should be easy enough.
What is too long?
So what is a too long flight? That’s not an easy question to answer. Racking our brains (and doing some guesswork), we came up with the following suggestions on what the upper fence on duration to different destinations should be. The durations are per leg:
OSL - LON 300 mins = 5 hrs. Given the minimum flight time OSL - LON = 115
OSL - BKK (Bangkok) 1000 mins = 17 hrs. Minimum = 674
OSL - KOA (Kona, Hawaii) 2000 mins = 33 hrs. Minimum = 1335
The minimum flight duration is clearly of interest to us. We store that away in Solr, and using the stats query from Solr on that field, we get the following data on a flight OSL-LON:
"stats_fields": {
      "minimumLegDuration": {
        "min": 115,
        "max": 815,
        "count": 3610,
        "missing": 36,
        "sum": 615655,
        "sumOfSquares": 123968775,
        "mean": 170.5415512465374,
        "stddev": 72.5080446083144,
        "facets": {}
A lot of good information there! We get the standard deviation, mean and min values. Missing the quartiles, though, but we can fix that!
And what is too short?
Sometimes, the supplier sends us incorrect data. That’s bad. But the good thing is that when the data is incorrect it is really incorrect. We sometimes receive flight times of 0 minutes. That is obviously wrong, and we filter out those. However, we have not seen any occurences of, say, 1 minute flight times. That would be wrong as well, but more difficult to handle. So we close our eyes and don’t care about those.
But hang on…
So, we were ready to go! We wanted to fix this problem once and for all. But before we started coding, we talked to emeritus Harald Goldstein at the University of Oslo. He’s been teaching statistics at the university level for years and had some good feedback on our theoretical solution. First of all, he pointed out that the solution we have outlined is a good solution if we have a symmetrical distribution of the flight durations. The quartiles and the standard deviation works well on a symmetrical distribution like the normal distribution, but what about our data? Is it normal distributed? That was a relevant question, and as one of FINN’s main strategies is “data in our backbones”, we surely needed to have a closer look at this.
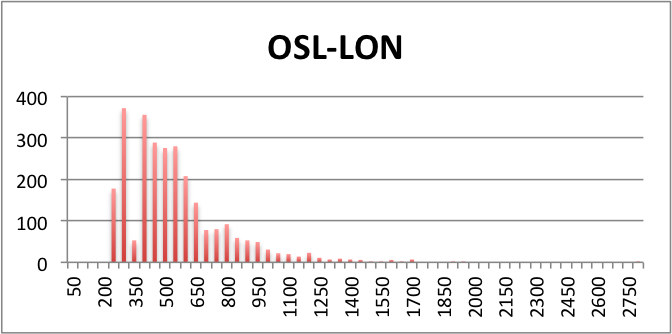
So here goes, flights from Oslo to London. Trip duration on the x-axis, number of occurences on the y-axis:

The shortest trip duration OSL - LON is 230 minutes in the graph above (115 min per leg) and there is even an outlier - which is not visible - at 2750 minutes! However, it is quite clear that this is not a normal distribution. It might look more like a gamma distribution for the part where x > 230.
Darn!
Back to square one
All the fancy statistics didn’t provide the solution, but it helped us really understand the problem. Obviously, we needed to re-think.
Logarithm
A problem with the solution from ages back (described at the beginning), was that it didn’t work very well on long hauls. The relation between the minimum trip duration OSL-BKK and OSL-LON is approx. 6:1. Alas, the upper fence must be relatively lower on longer trips. After some more brain-racking, we came up with the idea that we should look at this logarithmically.

A first suggestion
log(min BKK)/log(min LON) = log(675)/log(115) = 2,83/2,06
However, the relation is too far away from 6:1 and we are not able to compensate for long hauls.
Square root
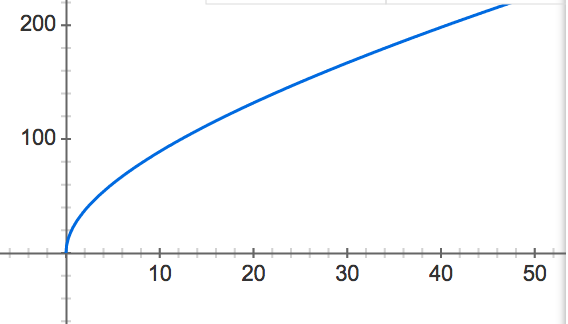
Finding quartiles doesn’t work, using a logarithmic approach doesn’t work very well. So what about the square root? That looks a bit like a logarithmic function.

Let’s try
sqrt(min BKK)/sqrt(min LON) = sqrt(675)/sqrt(115) = 26/11
This is much closer to 6:1 than the logarithmic approach. The relation is relatively more correct for both short- and long hauls.
The final solution
After some trial and error, we finally ended up with the simple formula of
x = min + A * sqrt(min)
Where x is the upper fence, min is the minimum duration for that leg and A is a tunable constant.
This formula seems to remove most of the unwanted outliers. Some examples (from our first iteration, with the constant A=25)
SVG-BGO. min = 70   => x = 279  (4.5 hrs)
OSL-LON. min = 230  => x = 609  (10 hrs)
OSL-BKK. min = 1350 => x = 2269 (37 hrs)
OSL-KOA. min = 2671 => x = 3963 (66 hrs)
OSL-NYC. min = 920  => x = 1678 (28 hrs)
That seems to work quite well. In the SVG (Stavanger) - BGO (Bergen) case, the formula removes approx. 30% of the offers. Some of them with a layover in Oslo.
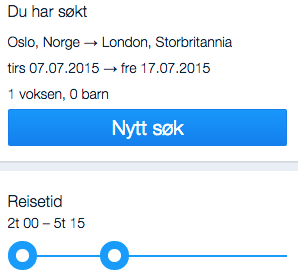
No need to hesitate then, this simple formula is now in our production systems. If you want to go from OSL to LON, you will get a slider which is preset with an upper fence of 5hrs 15min.

You still have the possibility to slide it to the max, though. All the way up to 27hrs 30min. The result list will then show you the unfiltered result set. But nobody wants to use 27hrs 30min on a flight from OSL to LON, right?

Conclusion
The simplest explanation is usually the correct one.
Tags: meta-search flight-search