This year’s summer intern team consisted of five technology students from UiO and NTNU and one in-house design intern. We have released continuously throughout an eight week period, and have ended with a final solution which is available to the public.
The problem presented for this year’s summer project was; What can FINN offer professional vendors at Torget to motivate them to continue advertising as professional vendors. To help us get started, we had a few meetings with FINN’s innovation team to work out an ambition and a few ideas. Our ambition was to create value for professional vendors that use Torget as a market to run their business. To achieve this we aimed to provide better advertisement insight for vendors, and give them a better look into their general performance at Torget.
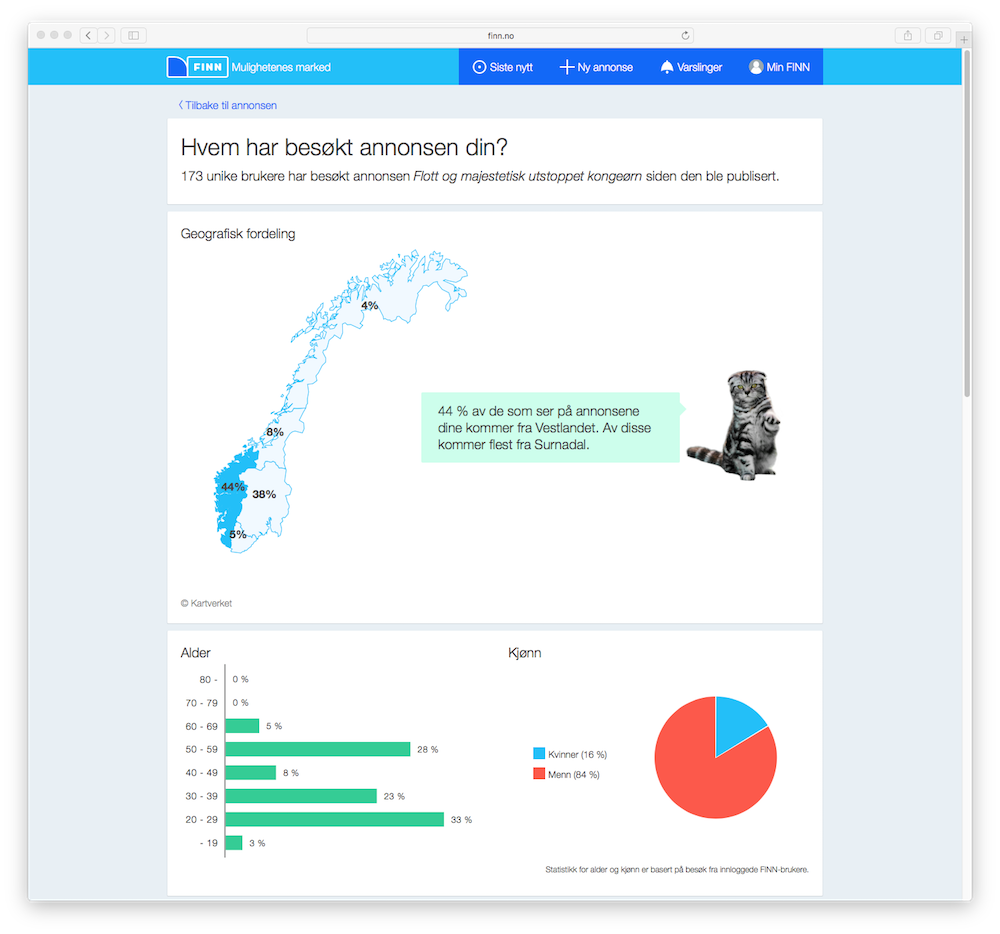
Our application consists of three main parts. The first presents geographical data about the ad’s visitors, show n on a map of Norway. This is primarily shown as percentages on each of Norway’s five regions, with more specific information shown in the cat’s conversation box. The latter also changes when the user clicks around the map. The second part of the application shows demographic data about the customers, which includes age and gender. Here we hope to open a more insightful relationship between seller and customer, which might for example allow sellers to properly target their correct customer group when advertising new products.
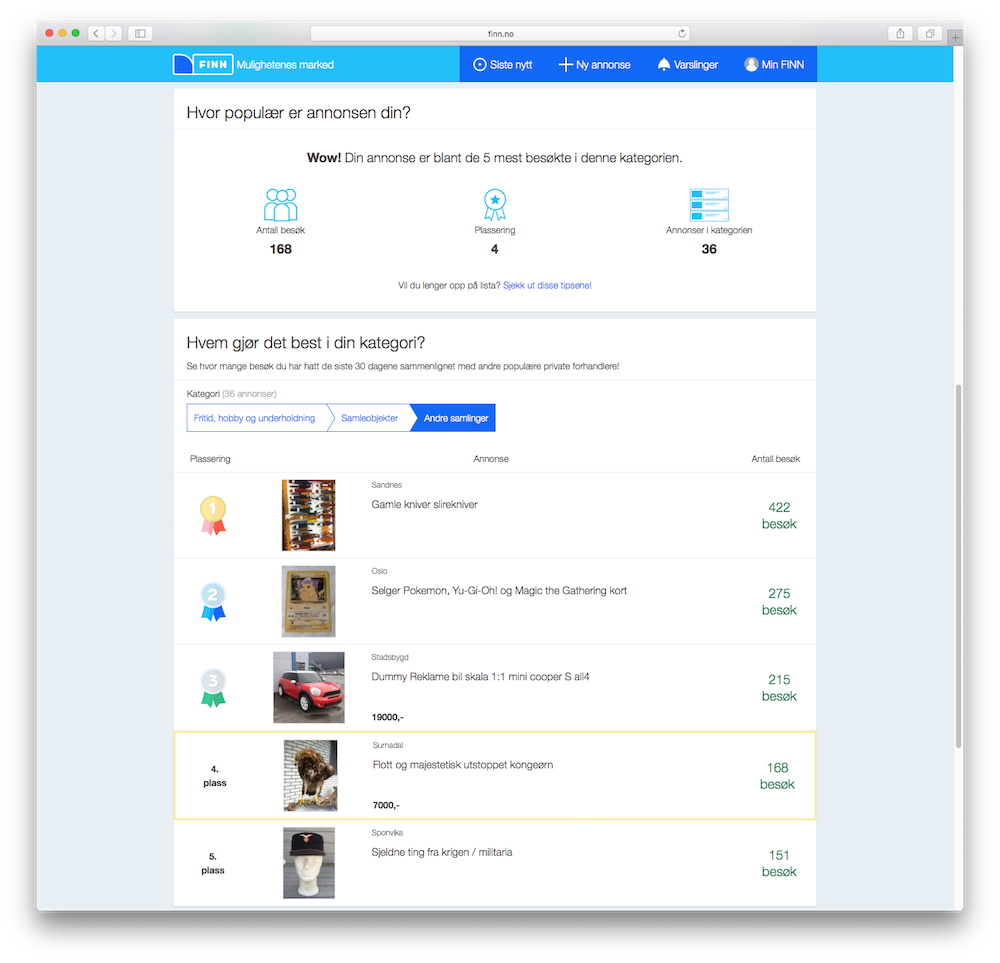
The last part of the application is a competitive ranking list that compares ads in the user’s category based on number of visits. This is shown with green text to the right of each ad in the list. The user also has the option to change which category they want to see the ranking for, in the blue menu. One of the main goals here is to give users an incentive towards comparing their advertisements to their competitors’, by letting them see what part of the market their customers prefer.
Implementing the application
The architecture we went with for the application can mostly be divided into two parts: One that collects statistical data, and one that presents that data to the customer. These meet in the middle through a PostgreSQL database.
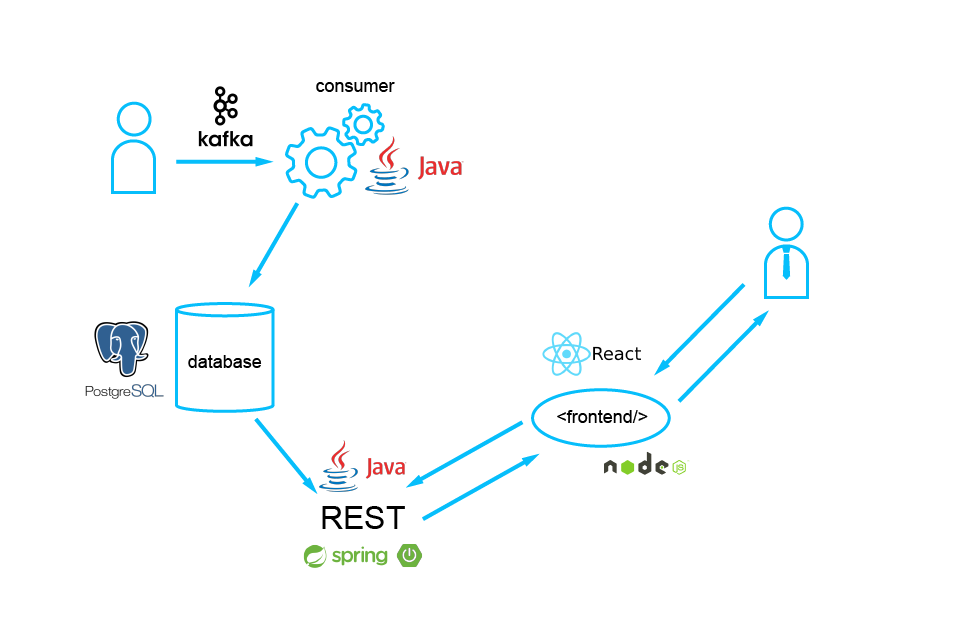
The collecting part of the architecture is made up of a Java application that listens to events using FINN’s messaging broker, Kafka. This is usually referred to as a consumer. In our situation the consumer receives a message every time a user clicks on a sales ad, so that we can continue to aggregate anonymous statistical data for that specific ad.
The presenting part is mostly made up of a three layer hierarchy. At the bottom we have a Java REST-API that reads from the database, which is built using Spring Boot. The next layer is a Node.js application, which is responsible for responding to all customer facing requests. Upon receiving a visit this application performs an initial server-side render of the website, which is built using React. This also includes a primary API request, so as to be able to present a mostly complete website to the user on the first request.
This has the positive side effect that the application works decently even in browsers with JavaScript disabled. Upon receiving the initial render of the website the browser client takes over, which we consider the topmost layer of the presentational hierarchy. From here we fire off more API requests, to retrieve the data which is needed to present the rest of the website. This is an important step in maintaining a low average response time, as the user will be able to use most of the application while waiting for the other API requests to finish.
The geographical map and the statistical charts are made using D3.js. The map itself is written using pure D3, while the charts make use of the React friendly wrapper Victory. The data that lays the foundation for the map is transformed from raw Kartverket data to a D3 friendly format, using TopoJSON, a library made by the same author as D3. This allows us to build interactions with the map using regular D3 code, which we at the moment utilise to merge the Norwegian counties into larger regions, and to react to the user’s hover and click events.
The front- and backend applications are deployed in Docker containers, and managed through FINN’s new Kubernetes cluster. This follows FINN Infrastructure’s new deployment strategy, and has made our meeting with pipelines and deployment work easy.
The designers’ perspective
When creating new features, technology is obviously important, but making sure people can use it is just as essential. As the team’s designers, keeping the user in mind was our priority number one. We spent the summer sketching, prototyping, testing, and continuously iterating to make the final design as user friendly as possible. This required a close collaboration with the developers in the team and attention to detail.
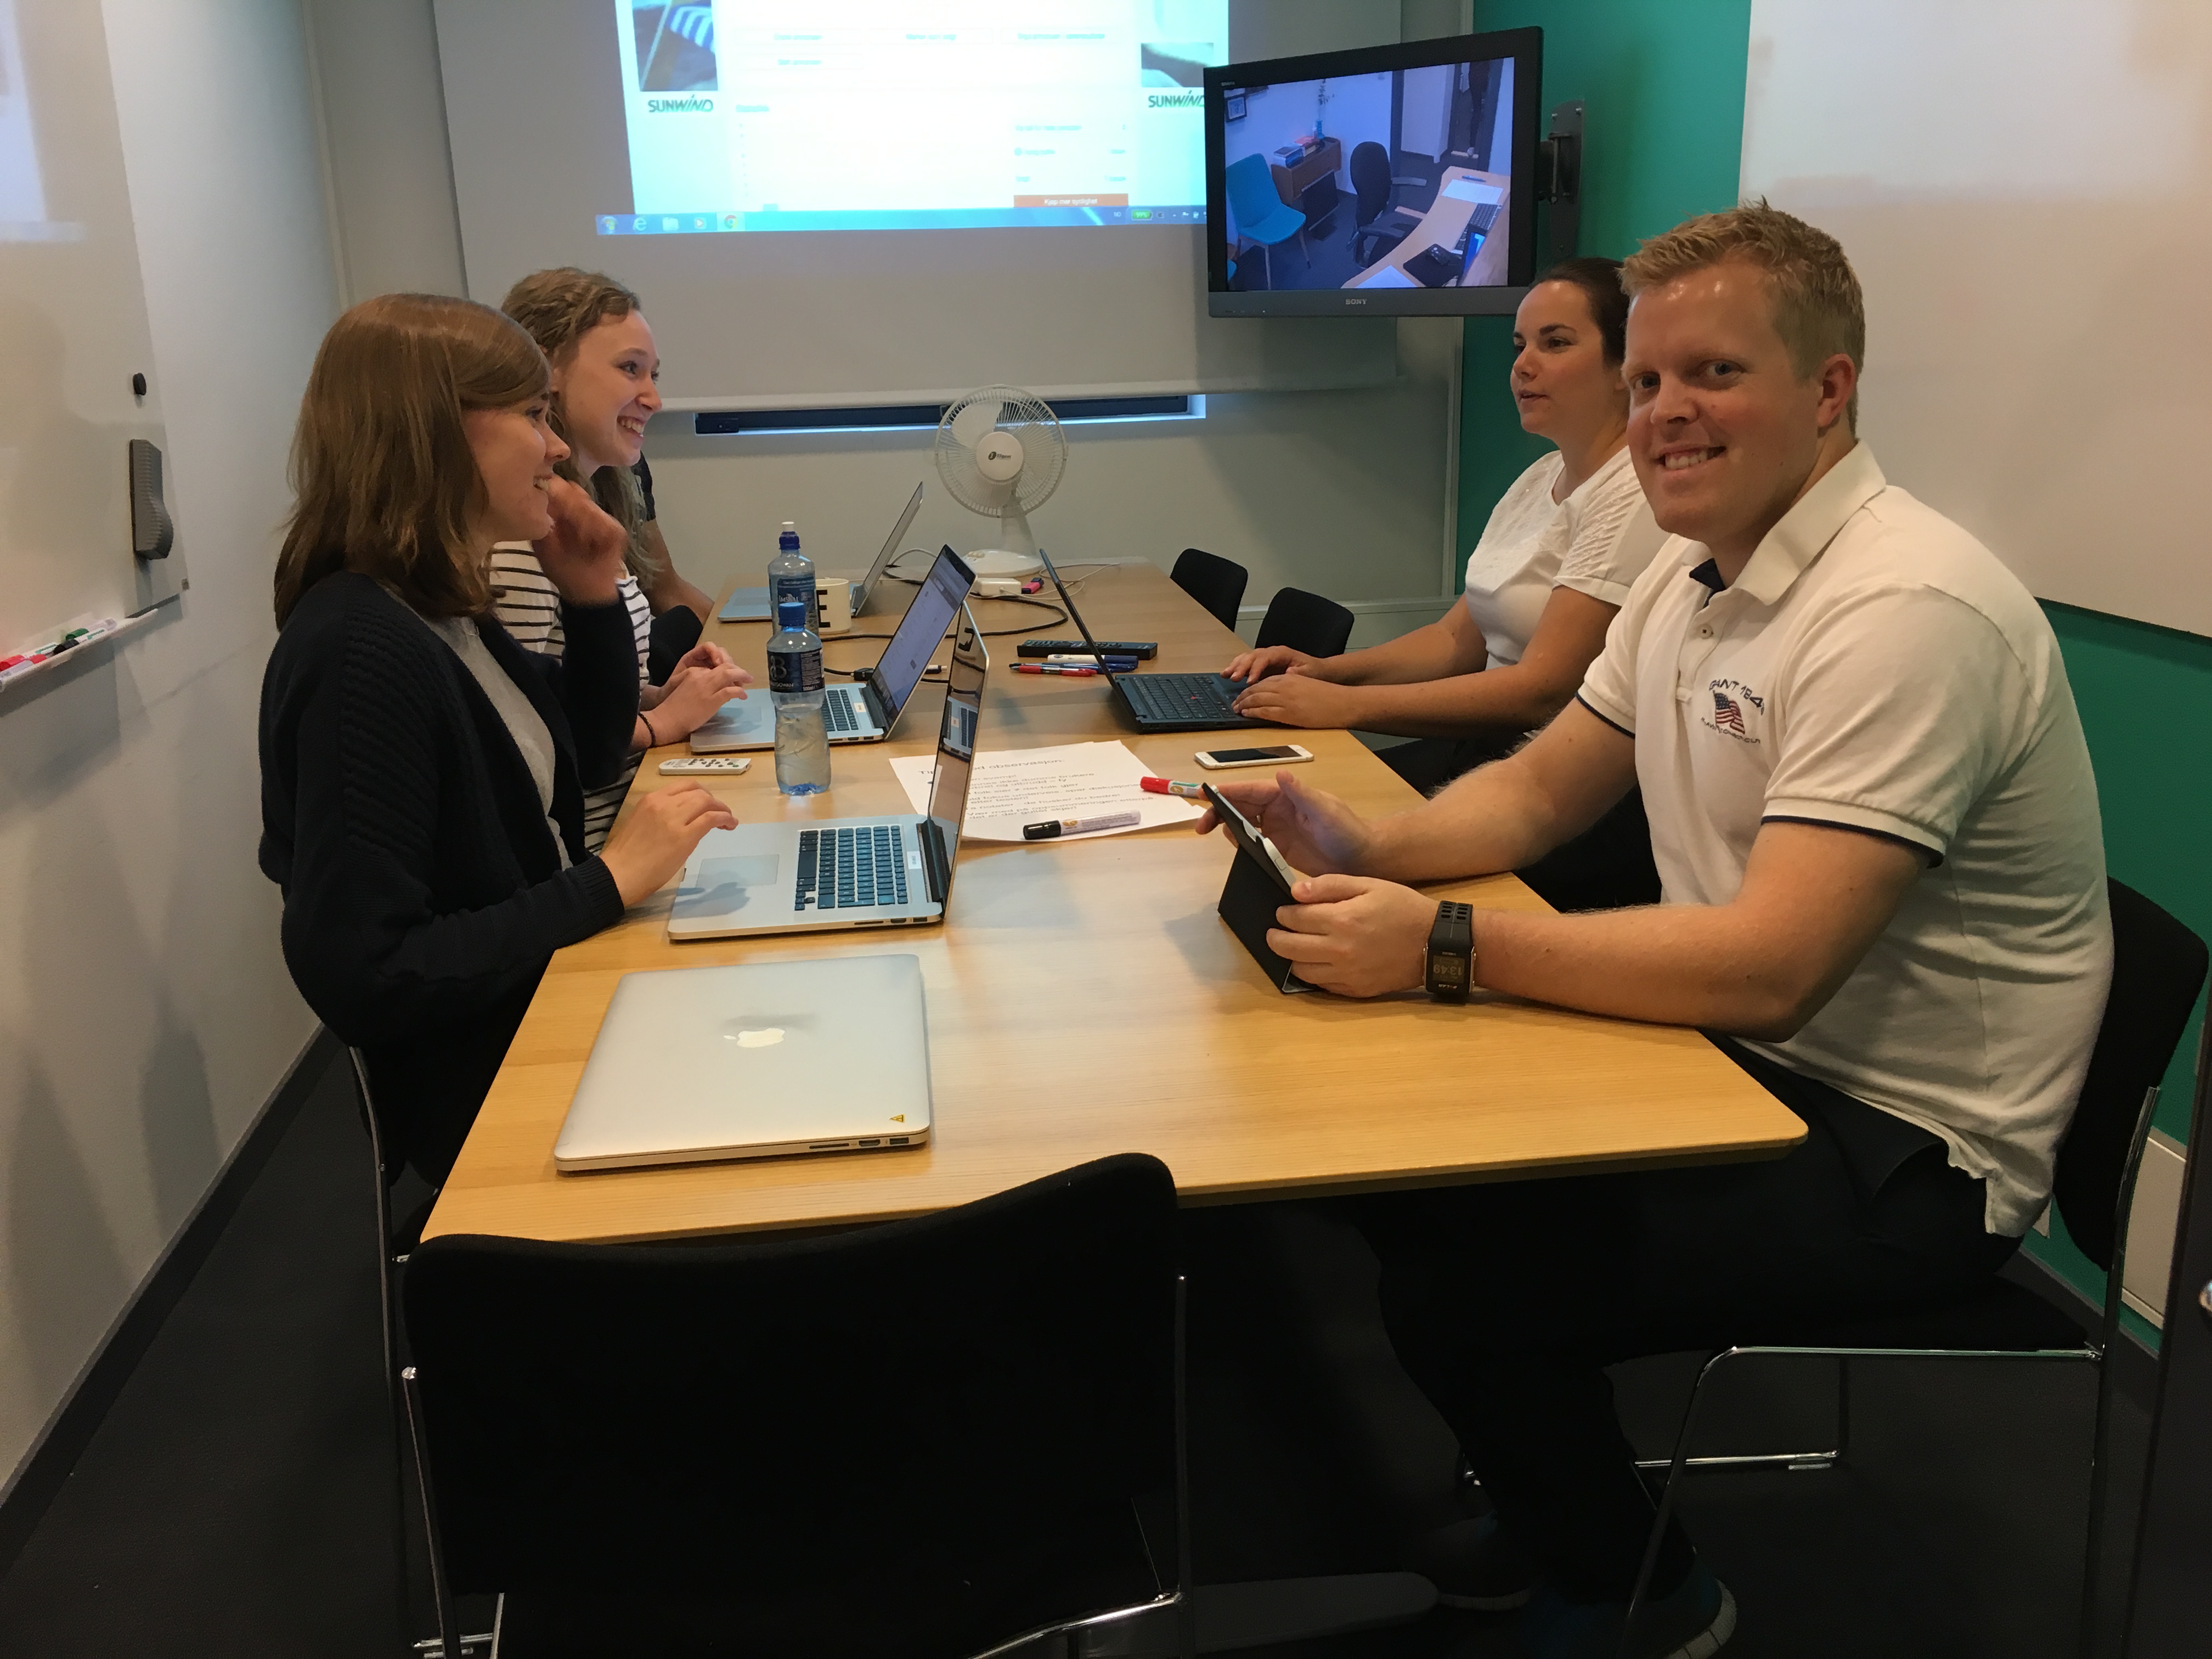
We started out with an idea workshop where we sketched out different layout suggestions. This worked as the basis for further development of the user interface. We then made clickable prototypes in Adobe Experience Design and Invision, which were used in both formal user tests in FINN’s usability lab and more spontaneous ones in the busy streets of Oslo. The purpose of these tests was to assess people’s understanding of the information presented to them on the screen, as well as general navigation and interaction with the interface. Based on this feedback we were able to improve the different features in the app and ended up with a result we’re very pleased with.
Final thoughts - this has been a fun summer!
After eight weeks of working at FINN we’ve had the pleasure of being introduced to a wide variety of both people and technologies. Asking for help has never been an issue, and we’re pretty sure we’ve bothered most of the people daring enough to work here this summer. To be able to release a product and receive feedback from actual users is definitely an exciting experience, especially for such a large customer base as FINN’s.
So long, and thanks for all the parrots.
