Last year, we presented the browser statistics of FINN.no as of June 2015. It’s time for an update!
How many visitors use a desktop or laptop?
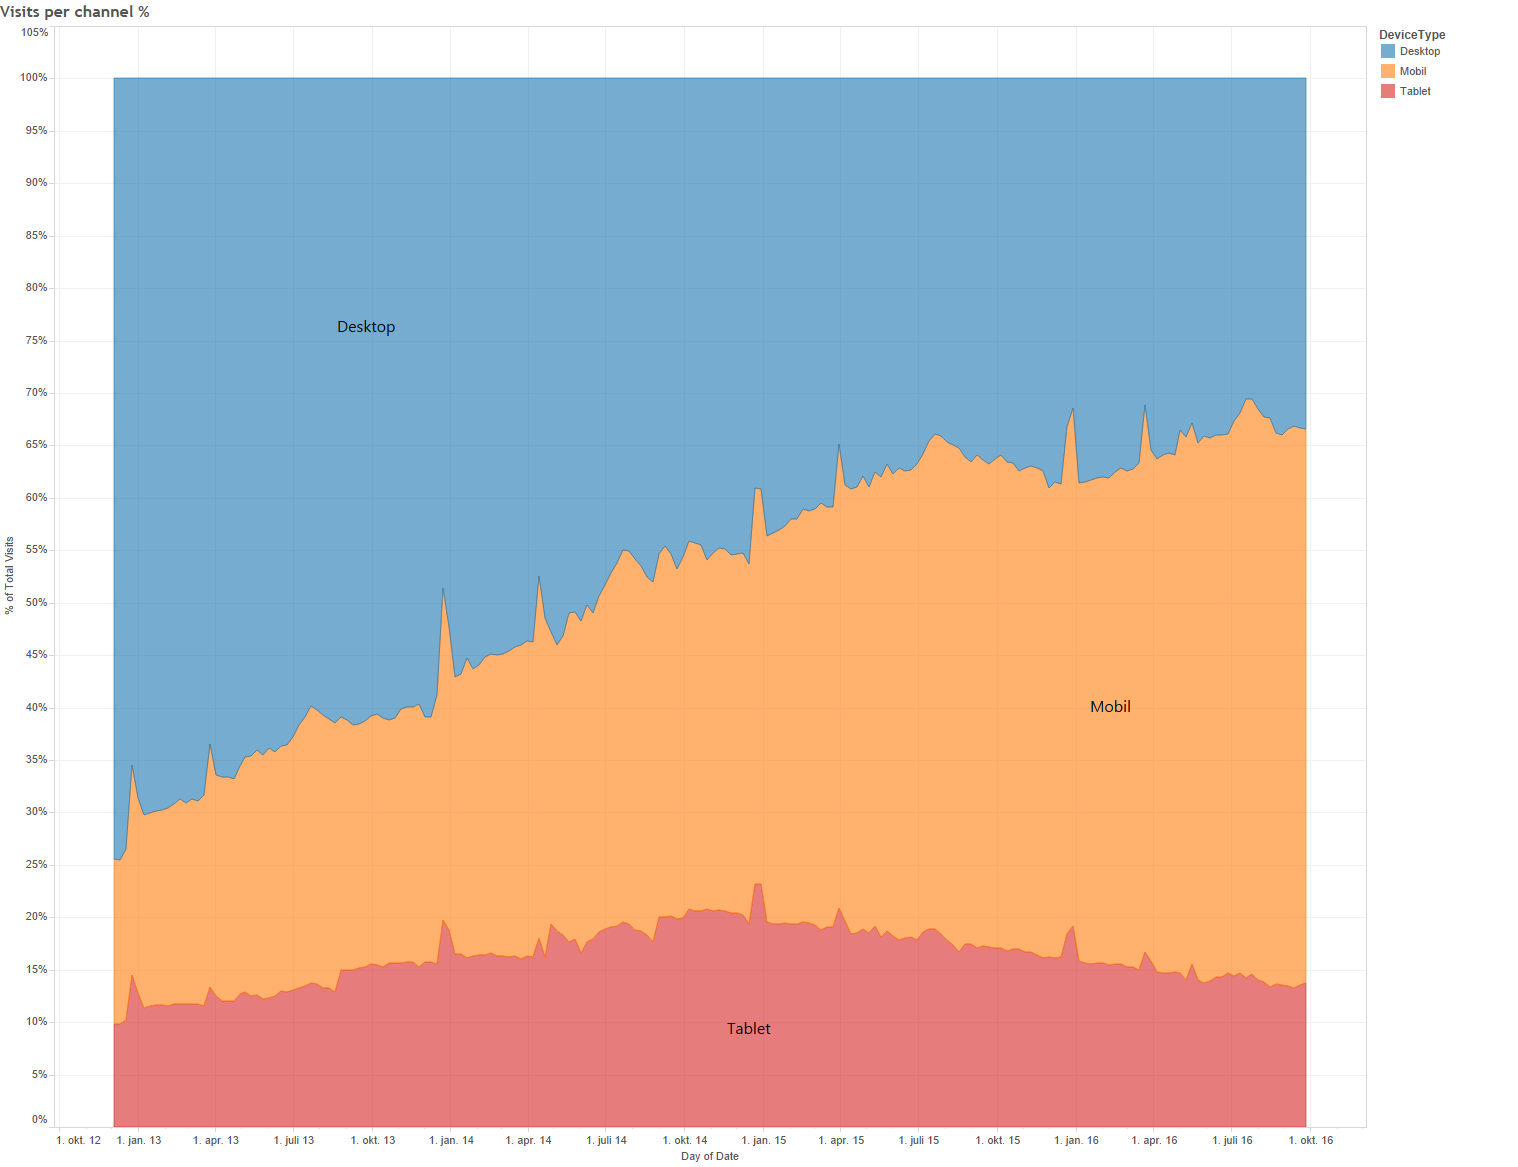
Our first graph shows the share of our users using a mobile phone, tablet or a desktop computer to access FINN.no, regardless of whether they use our responsive web app (m.finn.no), or a native Android or iPhone app. 66% of our visits are now from a smartphone or a tablet. The traditional desktop/laptop has a market share of 34%.
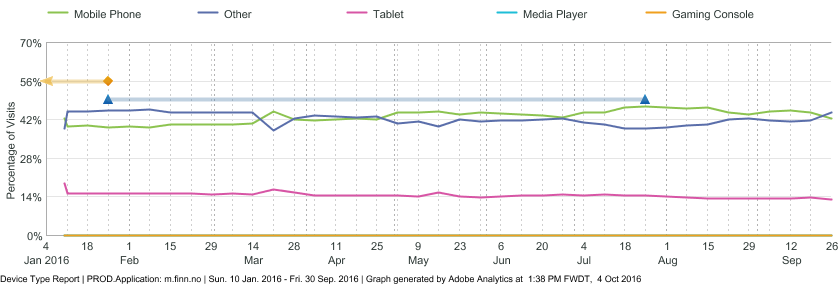
If we exclude the native app users, which are obviously on either Android or iOS, what is the distribution between table, mobile and “other” (desktop) on our web site?
Which FINN.no application do people use?
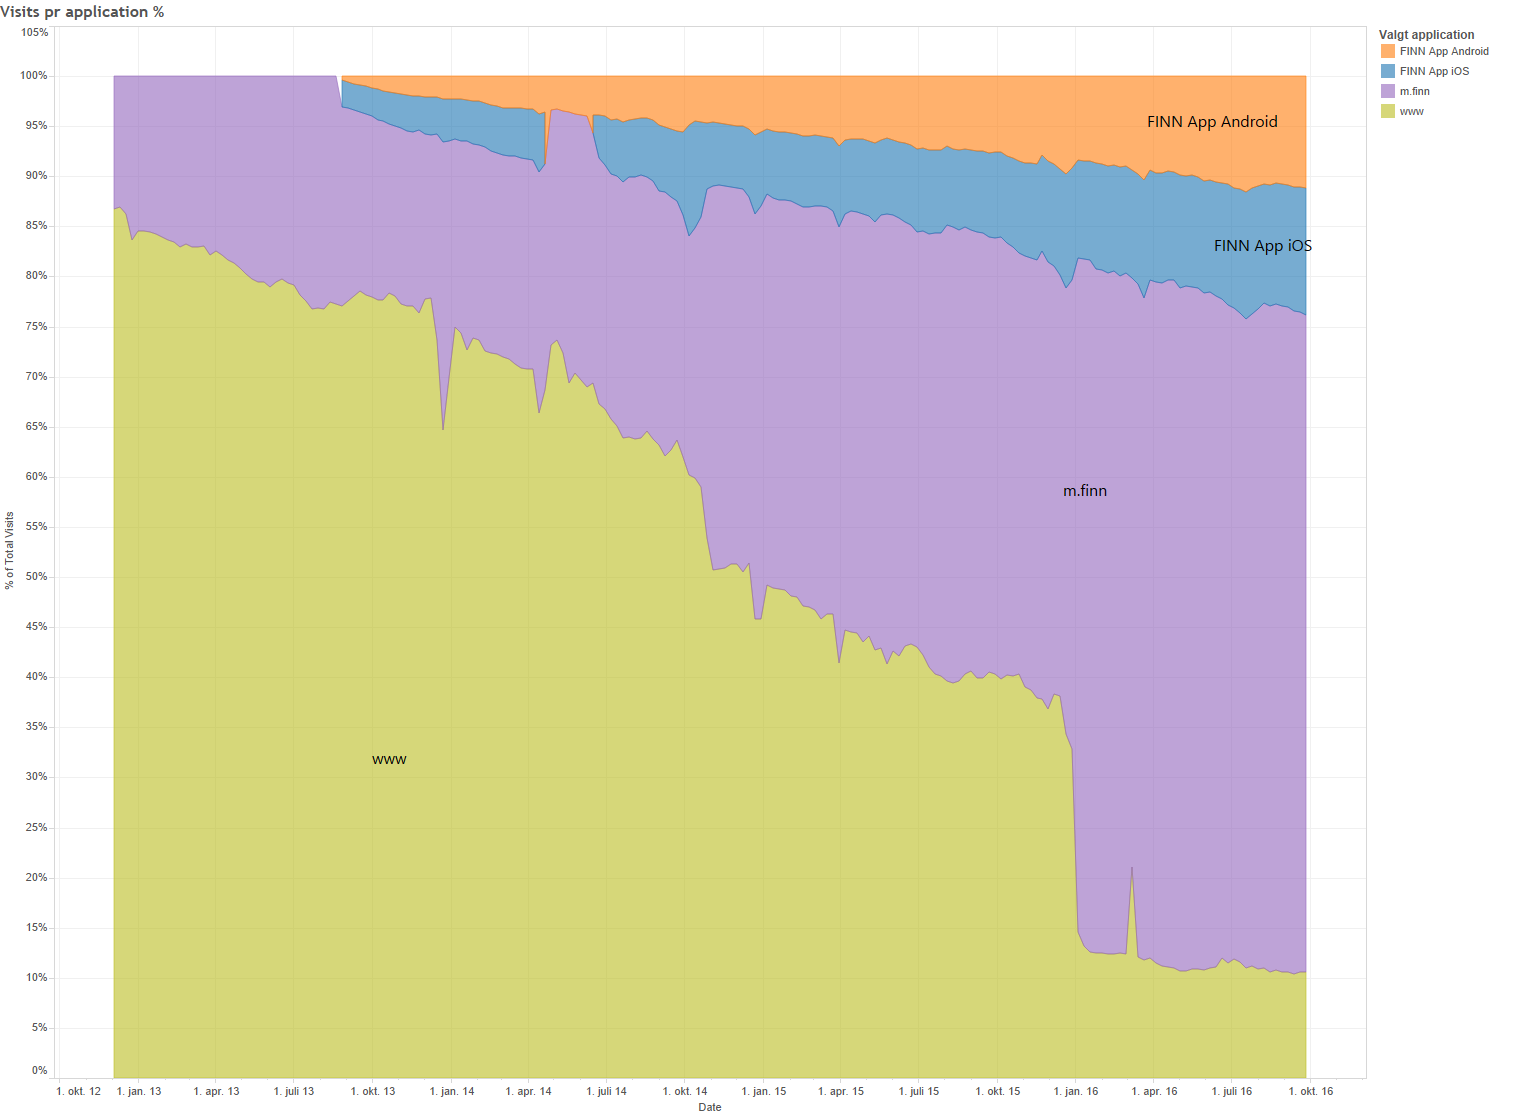
We have two major offerings of FINN.no - the responsive web (served from the domains m.finn.no and www.finn.no), and native apps for mobile devices. 24% of our visits are from our native apps, and 76% from our responsive web.
Since we’re in the middle of a migration, some of our internal details leaks out in this graph; some parts of the finn.no traffic is served from the domain www.finn.no and the majority from the domain m.finn.no. They are supposed to be merged “real soon now”.
Browsers
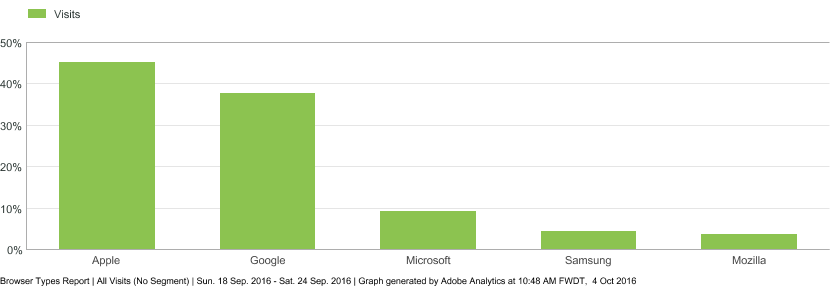
First of all, let’s take a look at the numbers of the browser vendors. The ranking is clear, Apple is the biggest, ahead of Google, Microsoft, Samsung and Mozilla. Opera is no longer in the top 5.
In case you wondered which browser is the biggest on the “desktop” here’s the trend. (Ignore the orange and blue triangle markers)
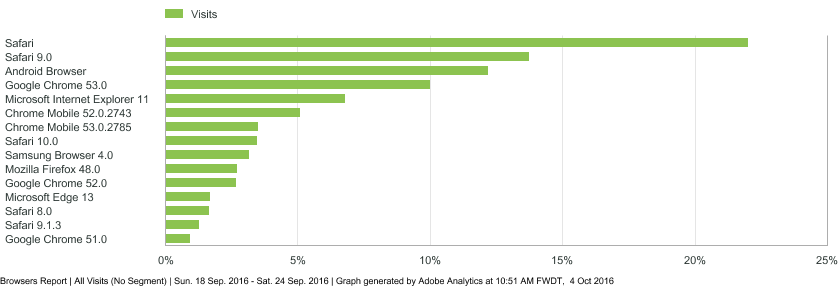
The complete browser statistics, across all applications and devices are as follows:
It still seems like a good idea to make sure your website works well with Safari! The old giant Microsoft now has only the 5th spot with IE 11 (6.8%) and the 12th with Edge 13 (1.7%).
Mobile details
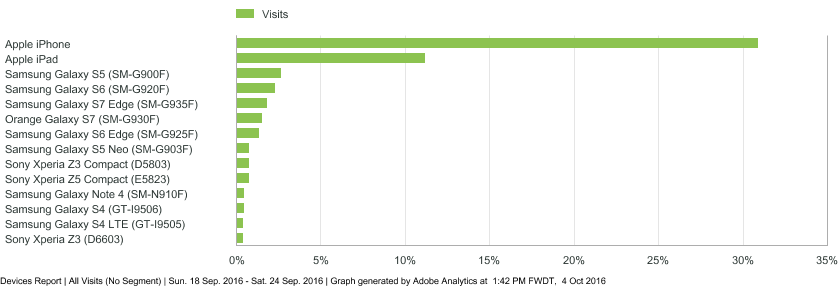
We got a request to give some more details about the mobile devices that uses FINN.no. Apple still has a strong position in Norway!
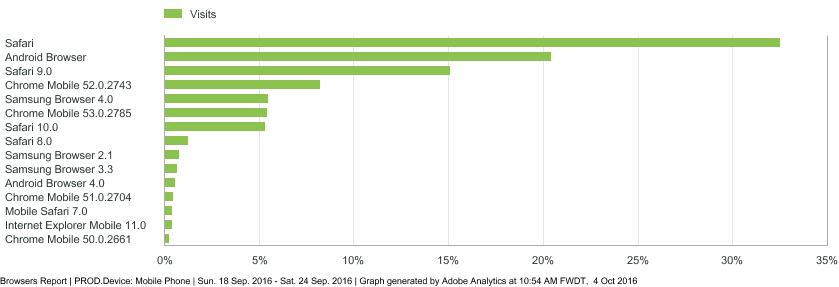
The most popular browsers on mobile devices:
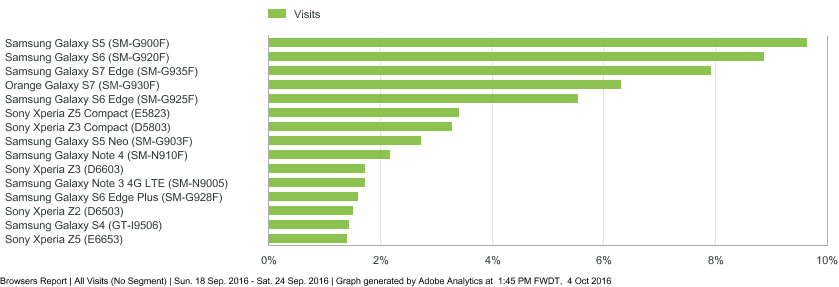
Then the question is - what is the “Android Browser”? This is the break down of devices that has delivered traffic from the “Android Browser”.
Similarily for the Samsung Browser:.
And finally the trend on mobile browsers, by vendor:
Which version of Android or iOS?
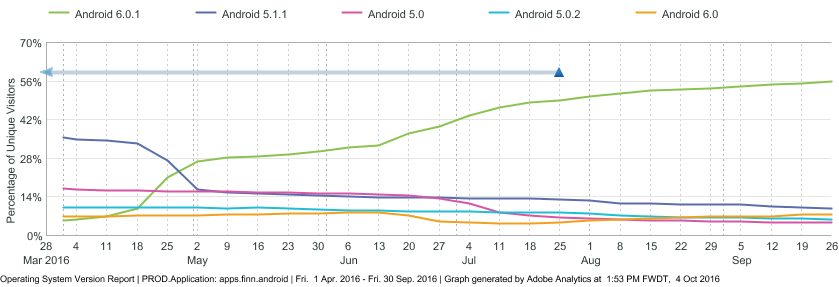
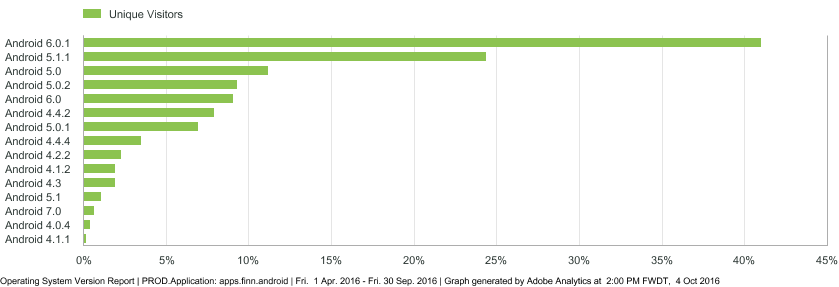
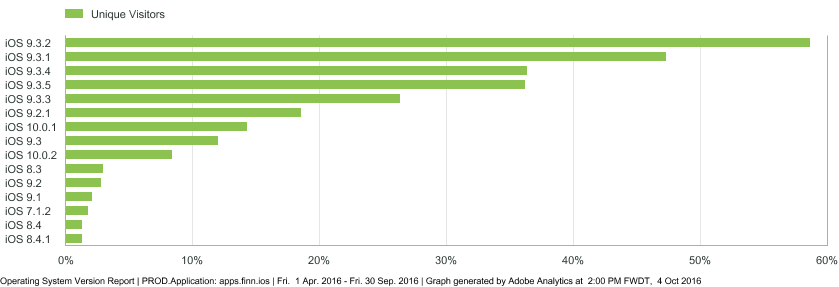
Our apps need to work well on several versions of Android and iOS. How fast are our users upgrading? This shows the distribution of operating systems among our apps users.
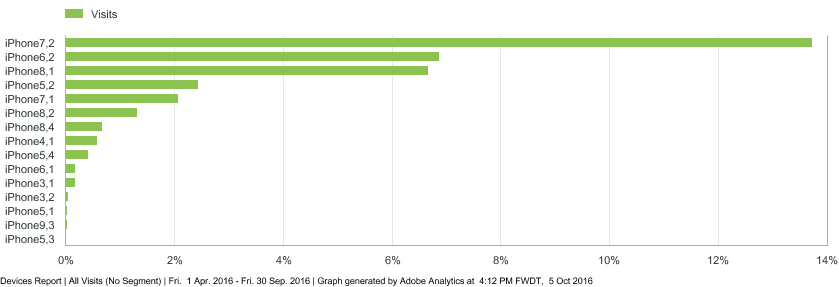
Given that the user have an iPhone, which models are in use? Unfortunately, the data are quite spotty, but this graph might still be an indication of the truth.
Tags: browser statistics
